Debugging
General Debugging Principles
Before diving into specific tools, here are key debugging strategies for OpenComponents:
1. Start Simple
- Test components in isolation using
oc dev - Use
oc previewto verify basic functionality - Check component info with
http://localhost:3030/component-name/~info
2. Check the Basics
- Verify Node.js and npm versions
- Ensure all dependencies are installed
- Check that your registry is accessible
- Validate component syntax and structure
3. Use Systematic Debugging
- Check browser console for JavaScript errors
- Examine network requests in browser dev tools
- Use verbose logging:
oc dev . 3030 --verbose - Test with minimal examples first
Common Debugging Scenarios
Component Won't Load
Symptoms: Component shows "Loading..." forever or displays fallback content
Debugging steps:
- Check browser console for errors
- Verify registry URL is accessible:
curl https://your-registry.com/your-component - Test component locally:
oc dev . 3030 && oc preview http://localhost:3030/your-component - Check network tab for failed requests
Template Compilation Errors
Symptoms: Component fails to render or shows compilation errors
Debugging steps:
- Validate template syntax (ES6, React, etc.)
- Check server.js for runtime errors
- Ensure all variables are properly defined
- Test with minimal template first
Publishing Issues
Symptoms: oc publish fails with various errors
Debugging steps:
- Use dry run first:
oc publish . --dryRun - Check authentication credentials
- Verify registry permissions
- Test package creation:
oc package .
Performance Issues
Symptoms: Slow component loading or rendering
Debugging steps:
- Check component bundle size
- Analyze network requests timing
- Review server.js logic complexity
- Test with caching disabled
IDE-Specific Debugging
Visual Studio Code
Debugging server.js with Visual Studio Code
When developing with OpenComponents, it is possible to use Visual Studio Code's debugger to step into code and perform advance debugging within the server.js of your components. In this tutorial, we'll see how.
-
Open a folder of components with your editor. In this example, oc is installed as dev dependency and there are 4 OC components:

-
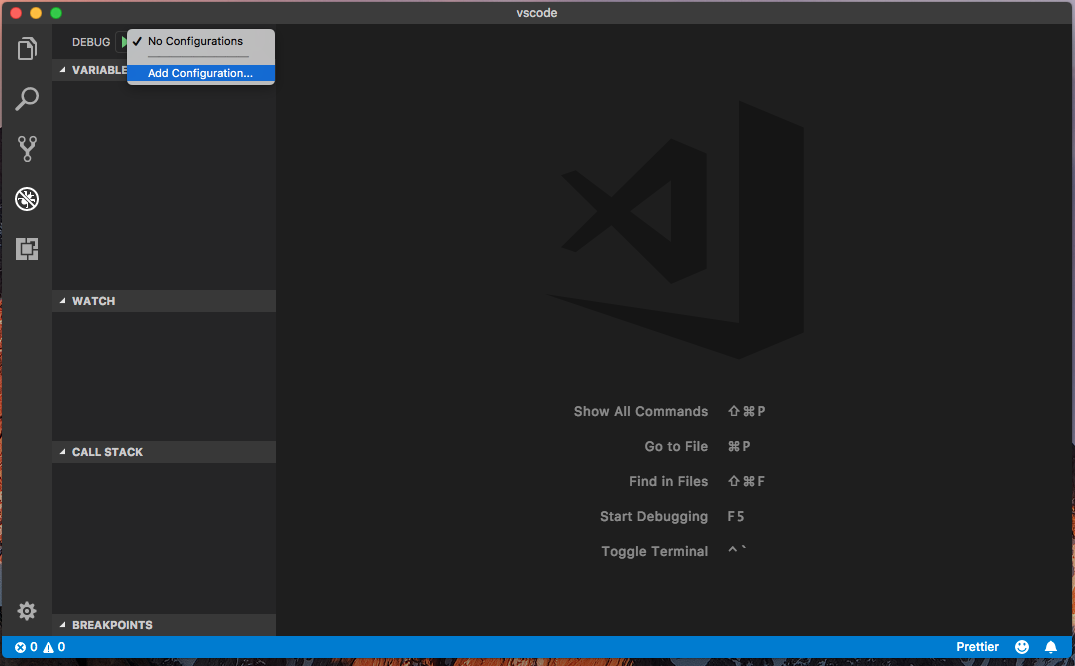
Click the Debug Button, and setup a new Configuration file for the launch tasks
-
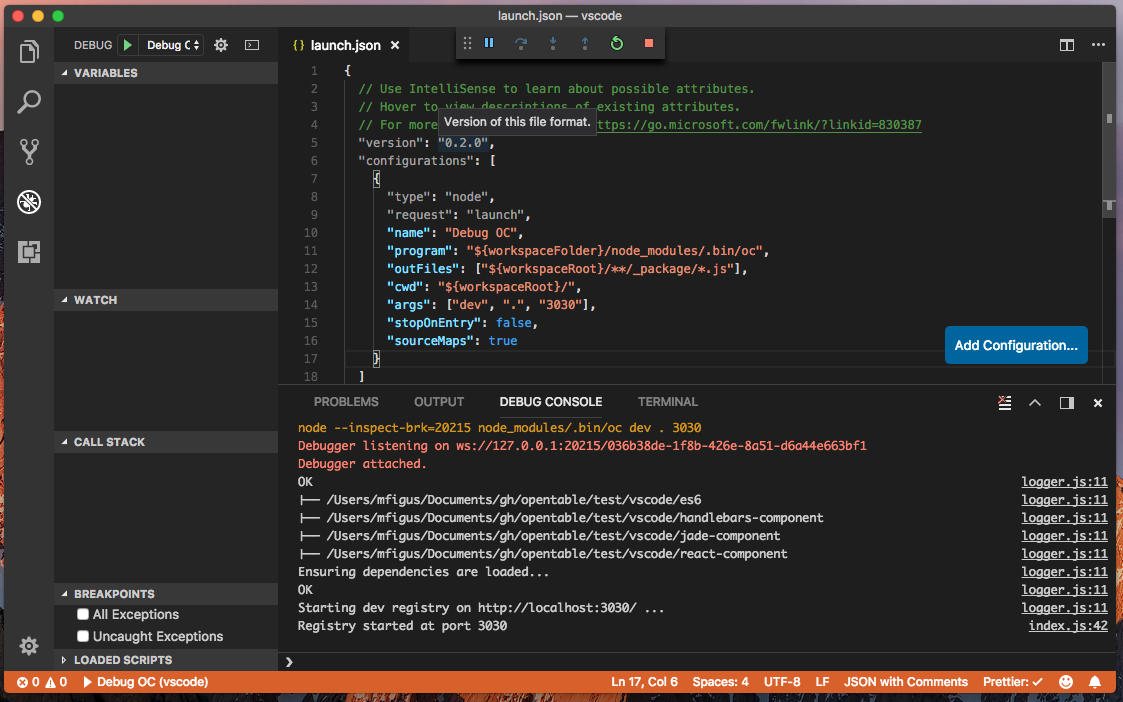
Setup the config file to locate the oc cli, the compiled server.js locations as shown here:
{
  // Use IntelliSense to learn about possible attributes.
  // Hover to view descriptions of existing attributes.
  // For more information, visit: https://go.microsoft.com/fwlink/?linkid=830387
  "version": "0.2.0",
  "configurations": [
    {
      "type": "node",
      "request": "launch",
      "name": "Debug OC",
      "program": "${workspaceFolder}/node_modules/.bin/oc",
      "outFiles": ["${workspaceRoot}/**/_package/*.js"],
      "cwd": "${workspaceRoot}/",
      "args": ["dev", ".", "3030"],
      "stopOnEntry": false,
      "sourceMaps": true
    }
  ]
}
-
Now hit the play button to start the OC cli:
-
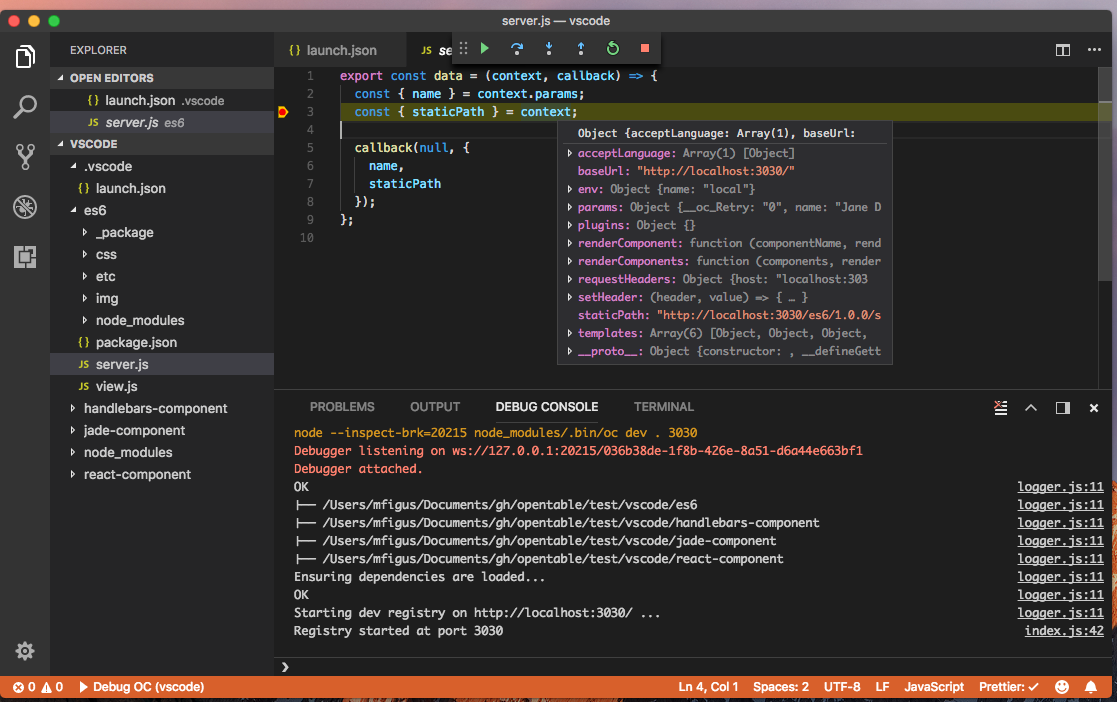
Now setup a stop in a server.js, make a request to your component via browser or curl, and get ready to step into your code:
WebStorm/IntelliJ IDEA
-
Create Run Configuration:
- Go to Run → Edit Configurations
- Add new Node.js configuration
- Set JavaScript file to
node_modules/.bin/oc - Set Application parameters to
dev . 3030 - Set Working directory to your components folder
-
Set Breakpoints:
- Open your component's server.js
- Click in the gutter to set breakpoints
- Start debugging with the green bug icon
-
Debug Console:
- Use the debug console to inspect variables
- Evaluate expressions in the current context
Chrome DevTools (Client-side)
-
Component Inspection:
// In browser console, inspect loaded components
console.log(window.oc.components);

// Check component cache
console.log(window.oc.cache);

// Monitor component events
document.addEventListener('oc:rendered', (e) => {
  console.log('Component rendered:', e.detail);
}); -
Network Analysis:
- Open Network tab before loading components
- Filter by XHR to see component requests
- Check response headers and timing
Command Line Debugging
Verbose Logging
# Start dev server with verbose output
oc dev . 3030 --verbose

# Check component info
curl http://localhost:3030/your-component/~info

# Test component with parameters
curl "http://localhost:3030/your-component?param1=value1"
Component Validation
# Validate component structure
oc package your-component

# Test publishing without actually publishing
oc publish your-component --dryRun

# Clean and rebuild
oc clean . && oc dev . 3030
Registry Debugging
# Test registry connectivity
curl https://your-registry.com/

# Check component availability
curl https://your-registry.com/your-component

# Test with different headers
curl -H "Accept: application/vnd.oc.unrendered+json" https://your-registry.com/your-component
Debugging Different Template Types
ES6 Templates (Default)
Common issues:
- Template function not returning a string
- Missing variables in server.js data
- Incorrect template literal syntax:
${variable}not{variable}
Legacy Templates (Handlebars)
Common issues (for legacy components):
- Unescaped special characters:
{{variable}}vs{{{variable}}} - Missing variables in server.js data
- Incorrect helper usage
Debugging:
// In server.js, log the data being passed to template
export const data = (context, callback) => {
  const result = {
    // your data
  };
  console.log('Template data:', result);
  callback(null, result);
};
React Templates
Common issues:
- JSX syntax errors
- Missing imports
- Incorrect prop types
Debugging:
// Add console logs in your React component
const MyComponent = (props) => {
  console.log('Component props:', props);

  useEffect(() => {
    console.log('Component mounted');
  }, []);

  return <div>...</div>;
};
Performance Debugging
Bundle Analysis
# Check component bundle size
oc package your-component --compress
ls -la _package/

# Analyze what's included
tar -tzf _package/package.tar.gz
Memory Debugging
// Monitor memory usage in browser
console.log('Memory usage:', performance.memory);

// Check for memory leaks in components
setInterval(() => {
  console.log('Components in memory:', Object.keys(window.oc.components).length);
}, 5000);
Network Performance
# Test component load times
time curl -s http://localhost:3030/your-component > /dev/null

# Test with different network conditions using browser dev tools
# Network tab → Throttling → Slow 3G
Error Handling and Logging
Client-side Error Handling
// Global error handler for components
window.addEventListener('error', (event) => {
  if (event.target.tagName === 'OC-COMPONENT') {
    console.error('Component error:', event);
  }
});

// Component-specific error handling
document.addEventListener('oc:error', (event) => {
  console.error('OC Error:', event.detail);
  // Implement fallback logic
});
Server-side Error Handling
// In server.js, always handle errors gracefully
export const data = (context, callback) => {
  try {
    // Your logic here
    callback(null, result);
  } catch (error) {
    console.error('Component error:', error);
    callback(error);
  }
};
Troubleshooting Checklist
Before Debugging
- Verify Node.js and npm versions
- Check that all dependencies are installed
- Ensure registry is accessible
- Confirm component structure is correct
During Development
- Test component in isolation
- Check browser console for errors
- Verify network requests are successful
- Test with minimal examples
Before Publishing
- Run
oc packagesuccessfully - Test with
--dryRunflag - Verify all dependencies are listed
- Check component works in production-like environment
Production Issues
- Check registry logs
- Verify CDN accessibility
- Test component endpoints directly
- Monitor error rates and performance metrics
Getting Help
When debugging fails and you need help:
-
Gather Information:
- Component code and configuration
- Error messages and stack traces
- Steps to reproduce the issue
- Environment details (Node.js version, OS, etc.)
-
Community Resources:
-
Create Minimal Reproduction:
- Strip down to the simplest failing case
- Remove unnecessary dependencies
- Provide complete, runnable example