Debugging
Debugging server.js with Visual Studio Code
When developing with OpenComponents, it is possible to use Visual Studio Code's debugger to step into code and perform advance debugging within the server.js of your components. In this tutorial, we'll see how.
-
Open a folder of components with your editor. In this example, oc is installed as dev dependency and there are 4 OC components:

-
Click the Debug Button, and setup a new Configuration file for the launch tasks
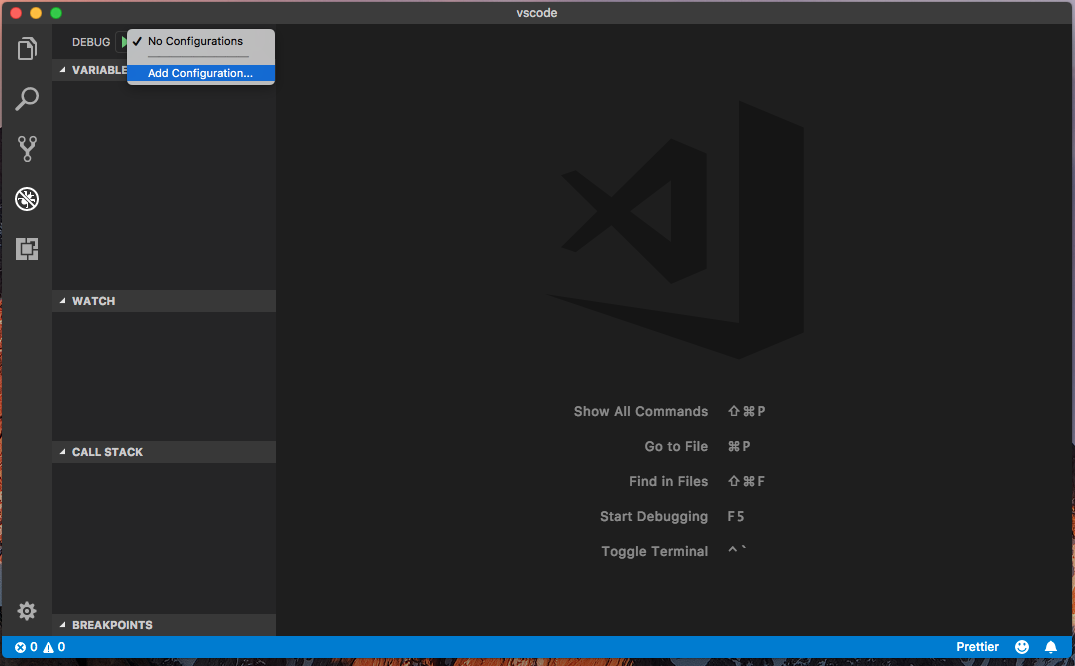
-
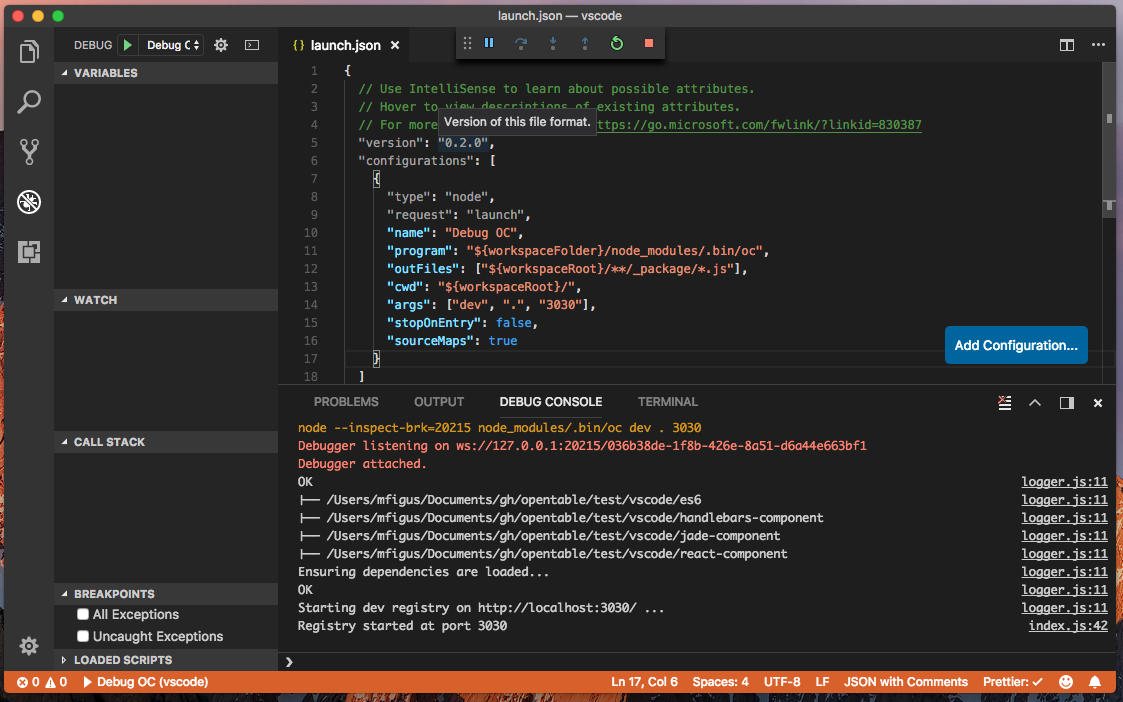
Setup the config file to locate the oc cli, the compiled server.js locations as shown here:
{
  // Use IntelliSense to learn about possible attributes.
  // Hover to view descriptions of existing attributes.
  // For more information, visit: https://go.microsoft.com/fwlink/?linkid=830387
  "version": "0.2.0",
  "configurations": [
    {
      "type": "node",
      "request": "launch",
      "name": "Debug OC",
      "program": "${workspaceFolder}/node_modules/.bin/oc",
      "outFiles": ["${workspaceRoot}/**/_package/*.js"],
      "cwd": "${workspaceRoot}/",
      "args": ["dev", ".", "3030"],
      "stopOnEntry": false,
      "sourceMaps": true
    }
  ]
}
-
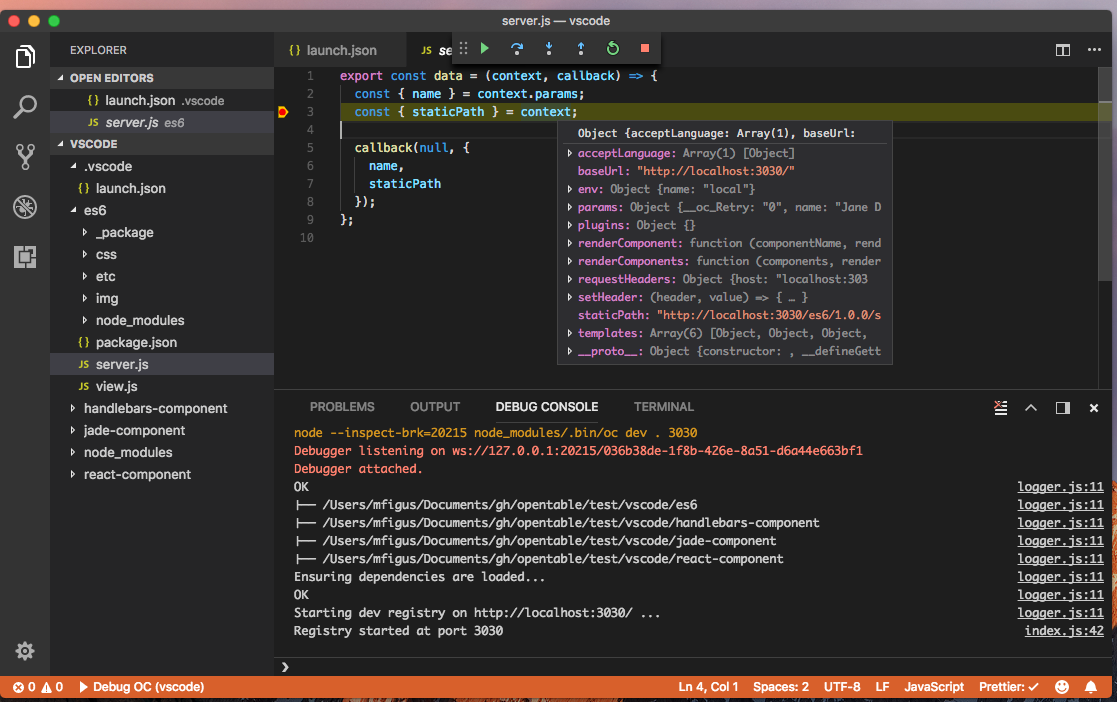
Now hit the play button to start the OC cli:
-
Now setup a stop in a server.js, make a request to your component via browser or curl, and get ready to step into your code: